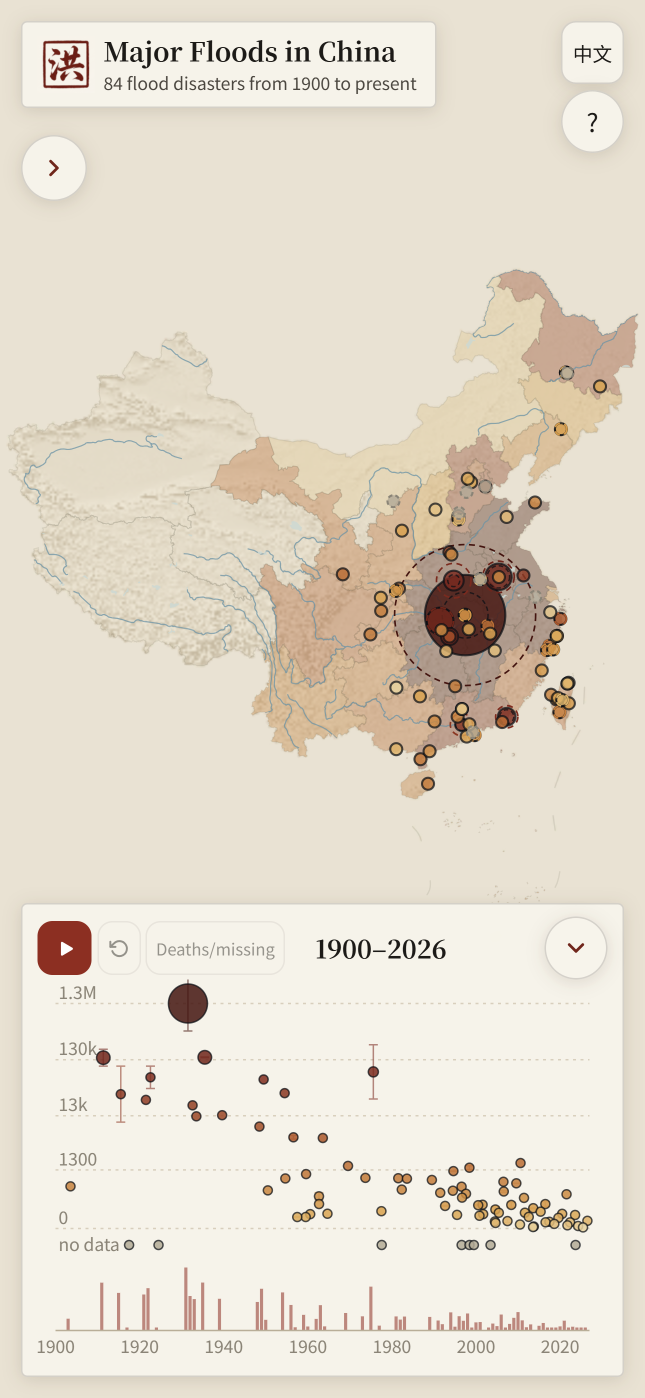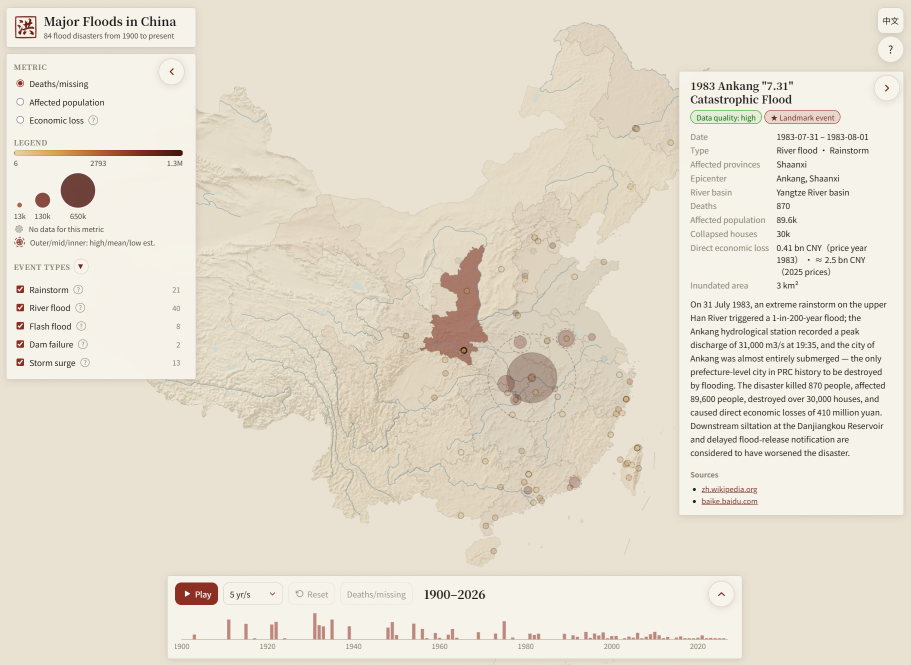
A couple of days ago, I came across some videos of the recent flooding in Guangxi. They were genuinely terrifying. Some areas received as much as 700 mm of rain in just 24 hours. To put that into perspective, Seattle averages only about 940–1,000 mm of rainfall in an entire year.
Out of curiosity, I started looking up a few numbers. One thing led to another, and I figured I might as well collect the data properly and turn it into a visualization. So I asked an AI to do the research. I wasn’t expecting much. Instead, it came back with an incredibly meticulous data collection and verification plan, then spent the whole day grinding through it (across four five-hour usage limit windows). I spot-checked several entries from the dataset it assembled—84 major flood events in total—and was convinced the work was rigorous enough to trust.
Not wanting to let all that effort go to waste, I spent another day working alongside it to build this website, which visualizes the dataset. The whole experience felt oddly like helping kids with their science project.