
Written in Chinese, translated by Claude Opus 4.5.
In my previous post, I discussed the “wisdom of crowds.” One passage noted:
A crucial premise of crowd wisdom is that “the crowd possesses a certain diversity.” In a group lacking diversity—that is, when most individuals are influenced by the same type of thinking—ensemble methods not only fail to bring benefits in accuracy but also amplify the bias of the results. […] Not to mention the phenomena of herd mentality due to over-reliance on opinion leaders and group polarization caused by only willing to express opinions within “echo chambers” under today’s pervasive social influence.
When most people are swayed by “erroneous or irrelevant” ideas, what good strategies do we have for extracting “the truth held by the few”? Today I’d like to share a fascinating pair of methods: Surprisingly Popular Voting + Bayesian Truth Serum.
Surprisingly Popular Voting
Let’s use a familiar TV quiz show as our example.
You’re a contestant facing a tough question with four choices—A, B, C, and D—scratching your head with no clue. So you decide to use a lifeline: asking the studio audience to vote1. Since the question is obscure, very few audience members actually know the answer. During the voting, someone in the audience mutters: “When in doubt, pick C,” and you notice some people nodding thoughtfully. Now you have a problem. Few people know the correct answer, while most of the clueless majority have just been influenced by the “pick C when uncertain” wave. You can fully anticipate that in the final vote tally, C will likely receive the most votes. The lifeline has become useless: you still don’t know what to choose. So now what?
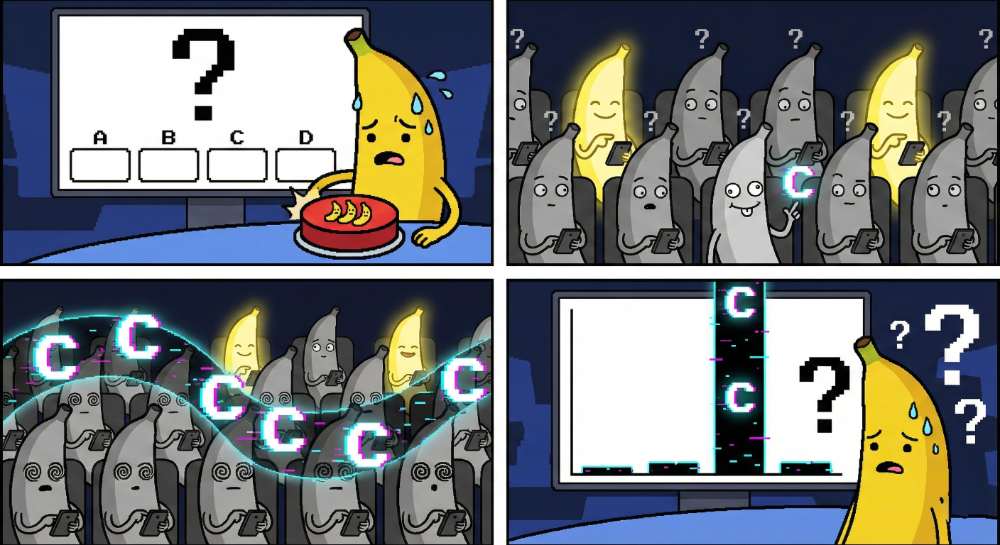
If the “pick C when uncertain” wave hadn’t swept through the audience, then no matter how difficult the question, as long as a minority possessed information beyond random guessing, a normal majority vote would help you: clueless audience members would choose nearly randomly among A, B, C, and D, while the remaining few would have a slightly higher probability of voting for the correct answer. Their “minority wisdom” would have a chance of breaking through the noise floor of random mass voting and emerging as the top vote-getter. But now, the uninformed audience members’ votes are no longer uniformly random—the “pick C” spell has bound their hands, and the flood of C votes will drown out the truly useful information.
You, being clever, may have already thought: if only we could know precisely how much the “pick C” wave influenced the audience. Without “pick C,” our estimate of the “noise floor votes” would be a uniform random distribution of “25% each for A, B, C, and D.” Uniform noise doesn’t affect the outcome of majority voting, but the non-uniform noise from “pick C” (also called “systematic bias”) does. Suppose we knew that the “pick C wave” would cause audience members who have no idea of the correct answer to produce a noise floor voting distribution of “A: 10%, B: 10%, C: 70%, D: 10%.” Then an intuitive solution naturally emerges: “Subtract this known noise floor distribution from the actual voting distribution, then take the highest result” (I’ll analyze the logic of this approach in detail below). Note that direct majority voting is also equivalent to “highest vote after subtracting uniform noise,” since uniform noise affects all options equally—subtracting it or not doesn’t change the ranking.
But who knows the precise impact of the “pick C” wave on voting proportions? Common sense tells us that C’s proportion will naturally be “somewhat higher” than the others, but “how much higher”? That’s hard to estimate precisely. Friends, don’t worry—recall the key conclusion from my previous post:
The emergence of crowd wisdom requires two conditions: the problem’s answer can be guessed via common sense but is hard to pinpoint precisely; and the individual answers possess a certain degree of random diversity. When both conditions are met, the crowd’s average judgment often beats the individual—even the expert.
Yes, for the specific numerical impact of the noise floor—why not ask the audience members themselves to estimate it?
While asking “What is your choice?”, we might as well add another question: “What percentage of other people do you think will make the same choice as you?” Earlier, everyone in the audience heard “when in doubt, pick C” and witnessed some people nodding along. Therefore, their estimates of the overall voting distribution will account for the influence of the pick-C wave. Thanks to crowd wisdom, we’ll obtain a relatively reliable noise floor estimate.
After collecting everyone’s responses, we can compile statistics in the following format (the data here is made up):
| Answer | Actual Vote % | Predicted Vote % (Average) |
|---|---|---|
| A | 9% | 10% |
| B | 9% | 8% |
| C | 62% | 71% |
| D | 20% | 11% |
Looking only at the first column, C received the most votes (popular); but after subtracting the second column’s noise floor estimate from the first, you’ll find that D received more votes than expected (surprisingly popular): it exceeded its predicted 11% by a full 9 percentage points, while all other options received fewer votes than predicted. In other words, C is the expected winner, while D is the unexpected dark horse. Following the “highest vote after subtracting noise” logic above, you should ultimately choose D.
This voting/tallying method is called “Surprisingly Popular Voting.”
In a surprisingly popular voting system, we add one extra question to traditional opinion-gathering: “What percentage of other people do you think will make the same choice as you?” The payoff for this additional question-and-answer cost is that we can now largely exclude from the results “mainstream factors that are irrelevant to, or even contrary to, the target.”
This is a highly counterintuitive voting solution. Above, I used an intuitive heuristic example with entirely made-up data, so you might not believe it actually works. But this method was originally proposed in a paper published in Nature in 2017, supported by extensive experimental data2.
The example repeatedly used in the original paper is “Is Philadelphia the capital of Pennsylvania?” Philadelphia is Pennsylvania’s largest city—a fact many Americans know; but Pennsylvania’s capital is not Philadelphia but rather the obscure city of Harrisburg. So for this question, most people’s answers are wrong. Here is real data from 51 respondents:
| Answer | Actual Vote % | Predicted Vote % (Average) |
|---|---|---|
| Philadelphia is PA’s capital | 66% | 71% |
| Philadelphia is not PA’s capital | 34% | 29% |
According to “surprisingly popular voting” (vote percentage minus predicted percentage, then take the highest), the answer should be “Philadelphia is not Pennsylvania’s capital” (34% of votes, 5% higher than the predicted 29%)—and this is indeed correct.
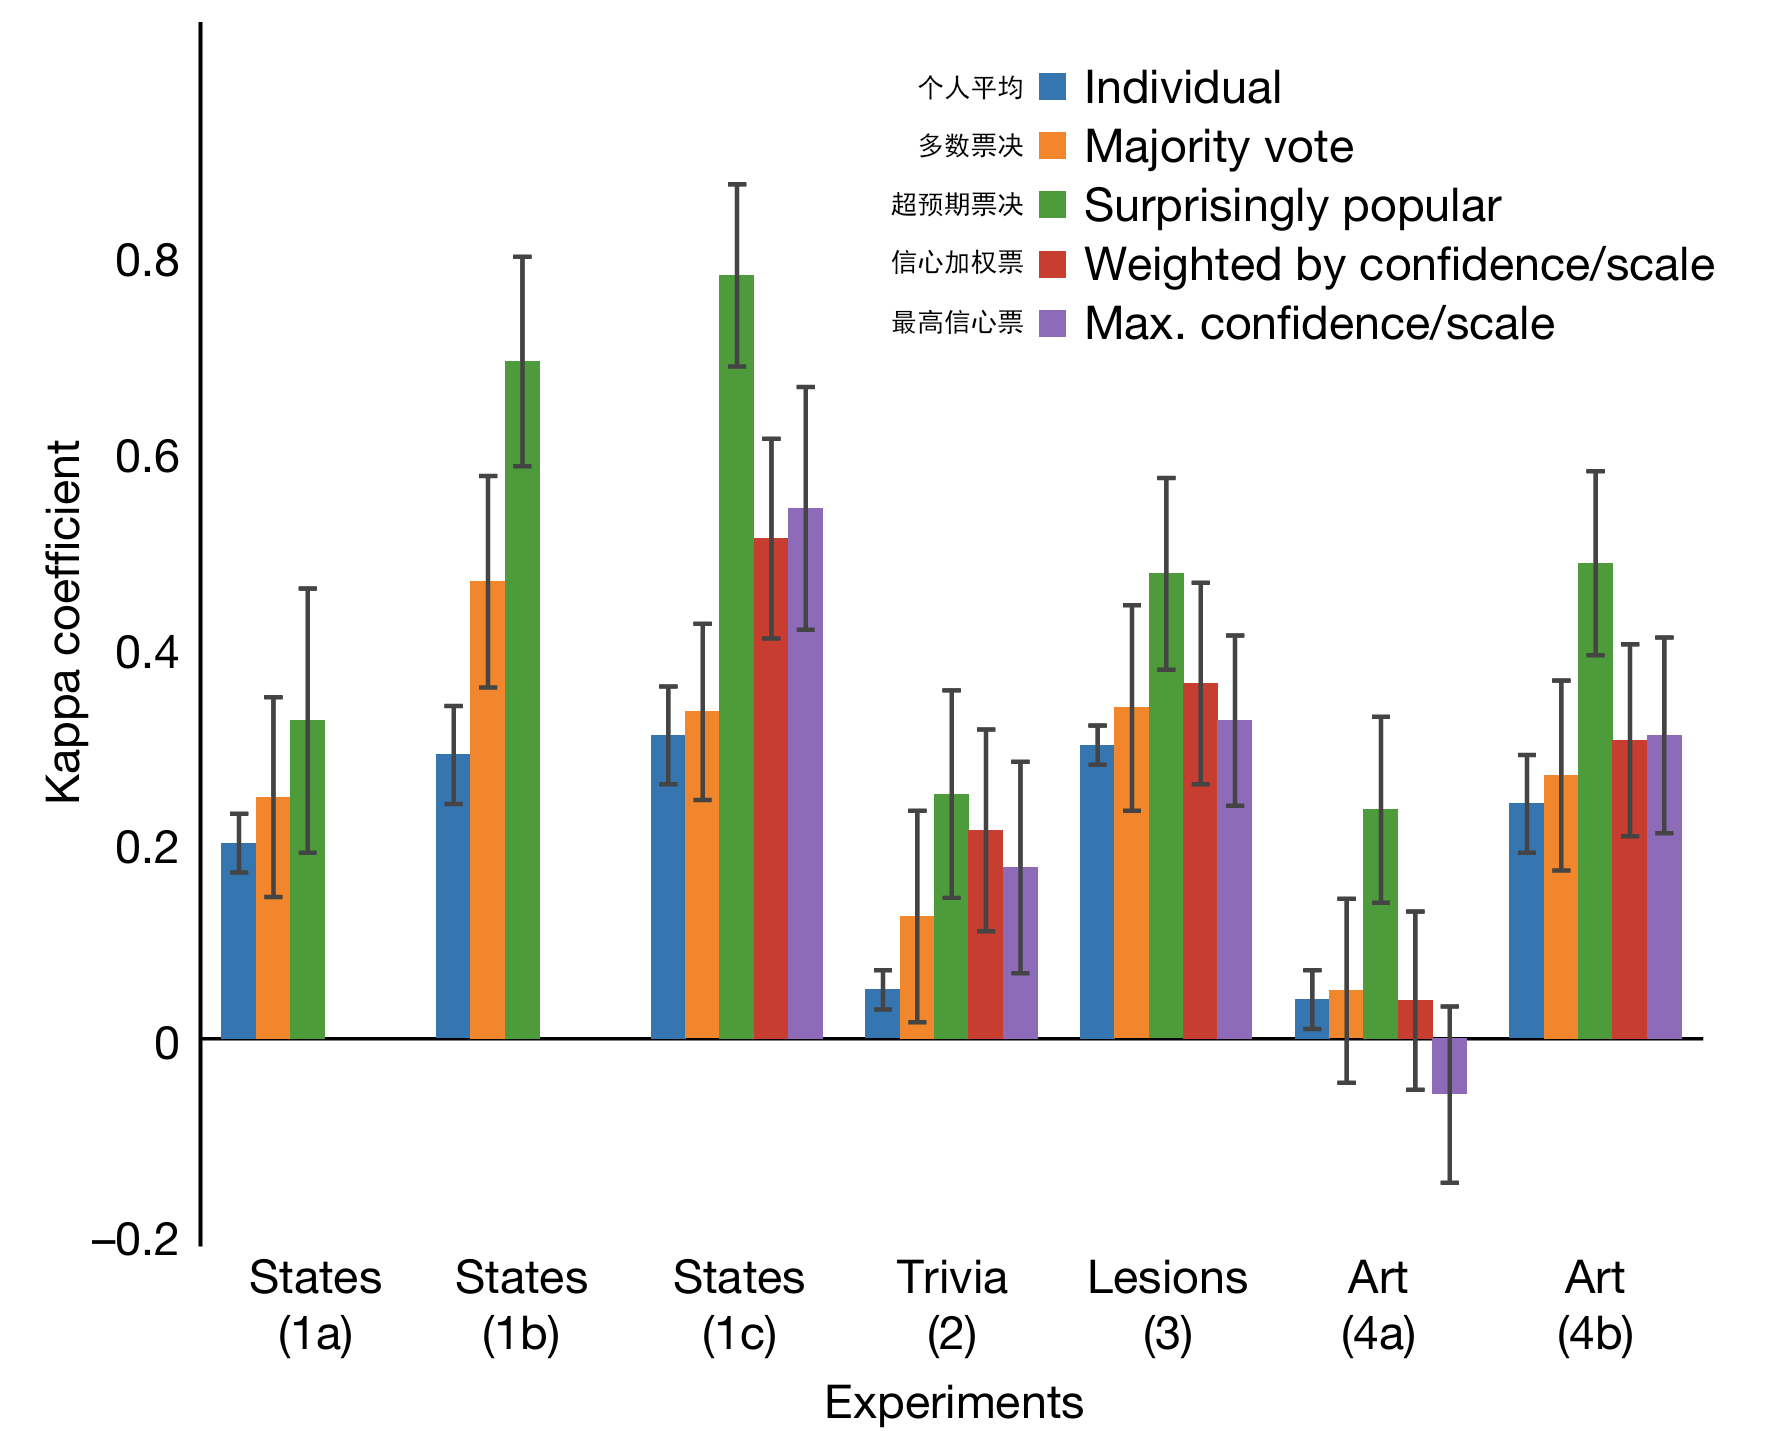
The original paper asked participants seven categories of common knowledge questions, totaling 490 questions, and observed that the accuracy of “surprisingly popular voting” exceeded majority voting by 21.3%–35.8%, and also exceeded confidence-weighted voting by 24.2% (see figure below). Though counterintuitive, this voting method does statistically yield more correct answers.
Let’s now carefully analyze exactly what “operation” surprisingly popular voting performs.
First, let’s divide the information contained in votes into two parts:
- Type A: Information related to the correct answer, such as “I read before that Harrisburg is Pennsylvania’s capital,” or “I heard a certain professor say the answer seems to be D.”
- Type B: Information unrelated to or misleading about the correct answer, but which influences overall voting behavior, such as “Philadelphia is Pennsylvania’s largest city,” or “When in doubt, pick C.”
The vote counts in the first column contain information of types A+B—both kinds. Of course, this assumes everyone who knows Type A information will vote accordingly, i.e., they’re motivated to “answer honestly” rather than play dumb or cause mischief. The second column contains information somewhere between B and A+B. Here’s why:
- People who don’t know Type A information can only predict Type B information’s influence on voting. (Since Type B information can influence overall voting, it follows naturally that the vast majority of voters should be aware of Type B information.)
- People who know Type A information will have two extreme boundary psychological states:
- They believe they’re among the rare few who know Type A information, while the masses have a blind spot—so they’ll only predict Type B information’s influence on the overall result
- They believe everyone knows A+B just like they do—so here they’ll estimate the influence of A+B
- Therefore, the information reflected in the second column should be between B and A+B; the scarcer A is, the closer this information is to B
So, subtracting the second column from the first is equivalent to removing the influence of Type B information (while also inadvertently removing a small amount of Type A information’s influence), leaving only the denoised result related to the correct answer (pure Type A information). In other words, “surprisingly popular voting” aggregates individual answers while filtering out “what everyone knows”—mainstream information—to prevent it from misleading the vote, emphasizing instead the true views of those with exclusive information.
Of course, if the question is too easy, then Type A information is known to everyone (i.e., no specialized knowledge is needed to answer), and actual vote percentages will be very close to predicted vote percentages, since both are estimating A+B. Subtracting the two columns will yield results close to zero. This phenomenon will show up in the voting data, so we can preset a threshold: when the difference between the two columns is below the threshold, use majority voting based only on the first column. This way, even if we don’t know the proportions of Type A and Type B information, we can still use “surprisingly popular voting” because it can automatically fall back to majority voting—at least it won’t produce worse results.
“Surprisingly popular voting” appears quite robust with broad adaptability. However, in one special situation, it not only fails to correct bias but actually misleads results. That’s when the following Type C information exists:
- Type C: Information unrelated to or misleading about the correct answer, but which influences only a portion of voters’ behavior
Negatively influential minority Type C information causes the first column to contain A+B+C types of information, while the second column lies between B and A+B+C (since only B is known to the masses). Thus, surprisingly popular voting not only fails to exclude Type C information but amplifies its overall impact—especially when Type A information is common knowledge: in that case, the second column lies between A+B and A+B+C, and subtracting leaves only C.
A simple example of Type C information: For the true/false question “The Earth is flat, not round,” what percentage of people do you think would select “Agree”? I’d guess your mental estimate is probably low: according to a 2021 survey of 1,134 American adults, a full 10% selected “Agree,” with another 9% selecting “Uncertain”3…
The conspiracy theory that “the Earth is flat” is largely unknown to the general public, but conspiracy believers strongly believe they’re among the few who know the truth. And “surprisingly popular voting” assumes precisely that “the truth is held by the few/experts”—we need only part the fog of the masses to reveal the truth. When the truth is held by everyone, this method won’t do better, but it won’t do worse either. However, when “specific errors are held by the few,” it fails and produces negative effects.
So to be rigorous, “surprisingly popular voting” is simply an aggregation method for extracting minority group opinions, automatically preventing mainstream opinions from drowning out everything. When to apply it requires careful consideration. In many application scenarios—especially when there’s a verifiable correct answer—Type C information is relatively rare, which is why “surprisingly popular voting” can outperform traditional majority voting in experiments and statistical terms.
Bayesian Truth Serum
Often, we’re not pursuing some so-called correct answer but simply want to extract the group’s genuine thoughts.
If one’s opinion can be quickly judged right or wrong (as in quizzes or exams), most people will honestly and earnestly submit what they believe is correct. But in more situations, people may be unwilling to express their true opinions. For example, in these three scenarios:
- When voting in elections, many members of minority groups know their voices are insignificant, so they’ll vote with the majority to avoid discrimination or exclusion later
- When using surprisingly popular voting, estimating overall voting results is mentally taxing. So many people will take shortcuts by “predicting” their own choice at 100%, or “predicting” 0% to maliciously boost the “surprisingly popular” nature of their vote
- When filling out market research surveys, many people will exaggerate their spending levels and purchase intentions to save face, or fill in randomly just to get the reward money
What can be done to incentivize groups to express their true thoughts? The answer may exceed your expectations: “Surprisingly popular voting” itself carries the core mechanism for “incentivizing honesty”!
“Surprisingly popular voting” with an attached incentive mechanism was originally called the “Bayesian Truth Serum”4. The method is simple. We tell voters that after collecting votes and predictions, the system will give them a certain (monetary) reward based on the results. The reward amount is positively correlated with the following metric5:
Reward = (Actual votes for their chosen option - Average predicted votes for that option) - K * D(Their predicted votes, Actual votes)
This formula rewards you for two things: First, whether your opinion was more popular than everyone expected (honest expression of unique views); Second, whether you accurately saw through the group’s overall thinking (accurate prediction of reality).
Let’s look at the second part. D(Their predicted votes, Actual votes) is the “difference” between the voter’s prediction and actual vote results—the further off, the less reward that voter receives. K is a preset weight factor. This second part measures your predictive ability and incentivizes you to think carefully. This solves the second scenario mentioned above (prediction being mentally taxing).
The first part rewards “your contribution of information beyond the noise floor”:
- If you’re a self-aware holder of minority opinions (i.e., you know you’re in the minority; this is the key information you can use to profit here), then this part rewards you for telling the truth, because you know the masses’ expectations will likely overlook the minority’s small voice. So answering honestly not only increases the chance of a final vote outcome favorable to you but also increases your material reward. Conversely, if you choose to answer dishonestly, you’ll likely reduce your reward (this part becomes negative). This solves the first scenario mentioned above (minority bandwagoning).
- Under certain general assumptions (everyone relies on rational Bayesian posterior probability calculations for predictions, and makes decisions assuming others tell the truth, etc.), it can be proven that choosing one’s true preference always yields higher rewards in this first part than other options. The proof is quite complex, its correctness depends on the choice of mathematical formulation, and the core idea isn’t very intuitive—I won’t introduce it here but recommend interested readers consult the original paper. This solves the third and most common scenario mentioned above (highest reward for truth-telling).
Because the Bayesian Truth Serum advocates monetary incentives, it’s generally applied in commercial domains, such as consumer survey feedback. If filling out a survey yields a fixed monetary reward, there’s no guarantee of response quality—some respondents will fill in randomly just to get the money quickly. Using the Bayesian Truth Serum and telling respondents their compensation will ultimately be distributed in this form can improve response truthfulness and prediction precision.
Research by the same author in 20136 showed that this method can significantly reduce lying/exaggeration rates in survey results: from 20%–24% down to 13%–14%, outperforming even having subjects publicly swear not to lie. Moreover, even without explaining the calculation mechanism of the Bayesian Truth Serum to respondents, simply telling them reward amounts across successive Q&A rounds allows respondents to subconsciously realize that “rewards are higher when telling the truth,” producing similar incentive effects.
In summary, the “Bayesian Truth Serum” uses the same mechanism as “surprisingly popular voting” to incentivize honest responses, particularly the informational value held by the few experts.
Conclusion
When I first heard about the “Bayesian Truth Serum,” I was completely puzzled—what kind of logic is this?! Then I read about “surprisingly popular voting” by the same author ten years later, and gradually came to appreciate its elegance.
The core of both methods lies in extracting not only individual views within the group, but also these individuals’ views about the group itself, and observing the difference between the two. This establishes a clever second-order reflexive relationship between the group’s “commonality” and “individuality”: The crowd wisdom actually aggregated from individual wisdom exceeds the crowd wisdom aggregated from individuals’ estimates of crowd wisdom. The crowd is not the monolithic entity that individuals imagine—it contains more complex minority wisdom waiting to be discovered.
Next time you want to hear someone’s unique opinion, try asking one more question: “What do you think others would answer?”
As mentioned in my previous post, on a certain American quiz show, the wisdom of crowds phenomenon resulted in audience voting achieving a 91% accuracy rate. ↩︎
Prelec et al., 2017. A solution to the single-question crowd wisdom problem. ↩︎
Prelec, 2004. A Bayesian Truth Serum for Subjective Data. “Truth Serum” here refers to injectable drugs that supposedly make subjects tell the truth. The Bayesian name comes from the mathematical proof involving Bayesian game theory: game theory under information asymmetry. ↩︎
The original paper uses logarithmically transformed differences, KL divergence, and geometric means, with rigorous mathematical proofs. Here I provide only a rough qualitative explanation, simplified to subtraction, “difference,” and averaging. ↩︎
Weaver and Prelec, 2013. Creating Truth-Telling Incentives with the Bayesian Truth Serum ↩︎